Corporate Water Use Deserves the Same Attention as Energy
A factory can track electricity per unit of production and still be unable to say how much water that same unit requires. Water supports manufacturing, food preparation, cooling, sanitation and the workplaces people depend on. Measuring its quantity deserves a place alongside energy in everyday business decisions.
The starting question is straightforward: how much water does your business use, where does it go, and what useful work does it perform?
TL;DR: Give water the same management attention as energy. Measure incoming supplies, identify major uses, track consumption against business activity and assign responsibility. Build a site water balance before choosing interventions. Then use the 4R framework, Reduce, Reuse, Recycle, Recharge, to improve performance and verify the outcome.
Companies already understand why electricity needs meters, operating targets and regular reviews. Water benefits from the same discipline.
For a plant manager, this means understanding water required per unit of output. For a hotel, it means connecting consumption with occupied rooms and services. For a corporate campus, it means distinguishing everyday demand from changes caused by occupancy, cooling or landscaping.
The aim is to make water quantity visible enough to manage.
Why should water receive the same attention as energy?
Water deserves management attention because it supports both core operations and the services that keep a workplace functioning. Its importance extends beyond the purchase bill. Production, cooling, cleaning and sanitation each depend on an appropriate supply reaching the right place when needed.
Consider how a business reviews electricity. Teams examine monthly consumption, identify large loads and investigate unexpected increases. They may compare performance across buildings, shifts or production lines.
Apply that approach to water.
Can the facility team explain last month’s consumption? Can it identify the largest users? Can it distinguish a production increase from a leaking pipe or an overflowing tank?
A water bill alone rarely answers those questions. A site may receive municipal water, draw groundwater and accept tanker deliveries. Different sources may have different records, making total consumption difficult to establish.
Bringing those quantities together gives management a clearer view of the resource supporting its operations.
Water quality remains essential. Alongside it, businesses need an equally clear account of water quantity.
Step 1: Establish how much water enters the site
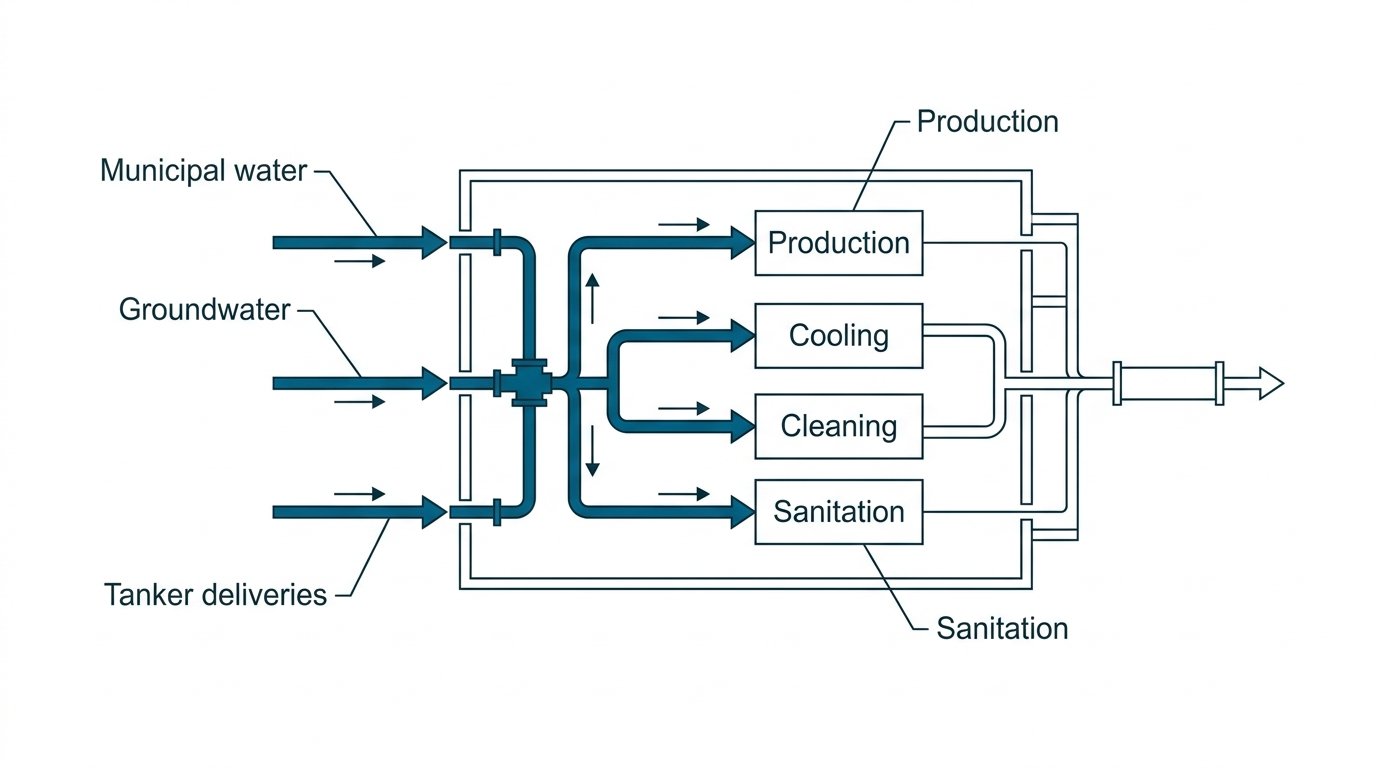
Start by recording every external source over the same reporting period. Municipal supply, groundwater and tanker deliveries should each have a traceable quantity. Document how each figure was obtained so the team can distinguish measured consumption from estimates.
Create a simple source register:
Use consistent units. Cubic metres and kilolitres represent the same volume: 1 kilolitre equals 1,000 litres.
Record opening and closing readings rather than relying only on a monthly total. Keep the dates consistent across sources.
Where metering is incomplete, label estimates clearly. Record the method and plan how to improve it.
A credible baseline can begin with imperfect information. It becomes useful when everyone understands what is measured, what is estimated and where the remaining gaps sit.
Step 2: Identify where the water goes
Map the main destinations before setting reduction targets. Separate production, cooling, kitchens, washrooms, cleaning and landscaping wherever those uses apply. This reveals which activities drive consumption and where additional measurement would improve decisions.
Walk the site with the people who operate pumps, tanks and treatment equipment. Compare drawings with actual connections.
A useful water map should show:
- Incoming sources and storage tanks.
- Major buildings, departments and production areas.
- High-volume equipment and processes.
- Treatment plants and treated-water destinations.
- Discharge points and changes in storage.
Prioritise meters where they answer an operational question. A cooling-system meter may explain a large share of demand. A separate landscaping meter may show why consumption changes seasonally.
You don’t need a meter on every tap to begin. You need enough visibility to explain the largest flows.
Ask the operators what happens during shutdowns, weekends and low-occupancy periods. Water continuing to flow during those windows may have a valid purpose. Measuring it helps the team establish what that purpose is.
Step 3: Build a water balance that explains the quantities
A water balance connects incoming water with consumption, discharge and changes in storage over a defined period. It helps a business account for the water passing through its site and identify quantities that need further investigation.
At the site boundary, the basic relationship is:
Water entering = water leaving + water consumed + increase in stored water
Water consumed can include evaporation or water incorporated into products. If stored water decreases, that stored volume also helps supply the period’s demand.
Internal reuse needs separate attention. Water moving from a sewage treatment plant to flushing remains inside the site boundary. Record that useful movement, while keeping it distinct from new freshwater entering the premises.
Otherwise, the same water can be counted repeatedly.
When the figures don’t reconcile, investigate the measurement and operating conditions. The difference could reflect a leak, an unmetered outlet, inconsistent reading dates or an estimate that needs correction.
The balance gives the team a structured way to find the explanation.
Step 4: Compare water use with business activity
Track absolute consumption alongside a measure of the activity it supports. Total water use shows overall demand. Water intensity shows how much water a business requires to deliver a unit of output or service.
Choose indicators that fit the operation:
Use a consistent definition for each indicator. If one facility includes cooling water and another excludes it, their figures need explanation before comparison.
Read absolute consumption and intensity together. A factory may improve water efficiency while total demand rises with production. Both changes matter.
And retain operational context. Weather, occupancy and maintenance can affect consumption. Good measurement helps teams explain these changes instead of reacting to a total without understanding it.
Step 5: Apply the 4R framework to measured demand
Use Reduce, Reuse, Recycle, Recharge as one connected approach to water management. Each action should address a defined opportunity in the water balance, with a baseline and a way to check the result.
Reduce: lower the quantity needed
Examine leaks, overflows, cleaning practices, equipment settings and fixture performance.
Record consumption before and after the change under comparable operating conditions. A completed repair is an activity; the measured change shows its effect.
Reuse: give suitable water another purpose
Identify streams that can serve another use safely, with appropriate quality checks and separate distribution.
Measure the receiving route. This establishes how much reused water actually supports demand.
Recycle: treat water for a defined destination
Connect treatment planning with a practical use. A treatment plant’s capacity and the volume actually reused are different figures.
Track treatment output, water delivered to the intended use and the freshwater requirement that remains.
Recharge: plan rainwater around site conditions
Assess catchments, contamination pathways, ground conditions, maintenance and safe overflow routes.
Design hydraulic capacity around relevant peak rainfall events. Annual rainfall can help estimate potential, while peak hourly or daily rainfall informs how the system handles incoming flows.
Record recharge separately from onsite freshwater substitution. Each represents a different outcome.
Step 6: Make water part of the operating review
Give water an accountable owner, a regular review date and a short set of consistent indicators. Facilities teams need practical readings. Management needs an explanation of changes and a clear view of which actions deserve attention.
A monthly review can cover:
- Total freshwater entering the site, by source.
- Consumption by major use where measured.
- Water intensity against business activity.
- Treated water actually reused.
- Unexplained differences and measurement gaps.
- Completed actions and verified outcomes.
Keep the discussion specific. Which flow changed? What explains it? What action follows?
For corporate sustainability teams, this discipline also creates better evidence for reporting. Records should connect reported quantities with meters, operating logs and documented calculation methods.
The immediate value is operational: the business understands its own water use.
Turn water awareness into a measurable practice
Water deserves a place in the same management rhythm as energy: measured consistently, reviewed regularly and connected to operating decisions.
Start with a shared reporting period. Bring source records together. Identify the largest uses. Build a balance that the facilities team can explain. Then choose interventions based on what the measurements reveal.
EcoLive’s water balance consultancy helps corporate teams connect these steps, from mapping sources and uses to identifying measurement gaps and planning improvements through the 4R framework.
With 1,150 completed projects across 11 states and 652M+ litres saved, EcoLive brings an outcome-led approach to water-conservation engineering.
Request a Water Assessment to understand how much water your site uses, where it goes and what your team can improve.
+91 9871472211 | ecolive.in
Email: connect@ecolive.in